4 Charts for Hulu's New CMO
Hulu lead the Monday news cycle with an announcement of a new CMO, Kelly Campbell- as covered expertly by Wayne Friedman. And while many might disagree about the role Hulu will play in the future of TV discovery, consumption and monetization-- virtually all will agree that her job is not an easy one. (We wish her luck!)We thought it would be fun to show where Hulu's $115 million in TV ad value went in the last year as a clue into what Campbell will be inheriting, in 4 simple charts.#1 The more than 5 billion impressions were-- (surprise?) mostly on live linear-- 4.2 billion of them at least. That means Hulu creatives saw a billion runs across OTT, local and VOD according to iSpot.tv which measures TV ad exposures from the glass of smart TVs. #2 Hulu likes to show up to the big parties. Rio Olympics, NFL Playoffs, The Super Bowl (is that huge Feb spike, below).Also- take note of the gray, that is the view rate-- or average time people spent watching Hulu ads without interruption-- also known as completion rate. Anyway, you can see what ad nerds call "creative wear"-- or the drop in attention, usually when an ad is reaching burn out with consumers. See how the fall campaigns got stale? Campbell should dig in here, there is winning to be had.
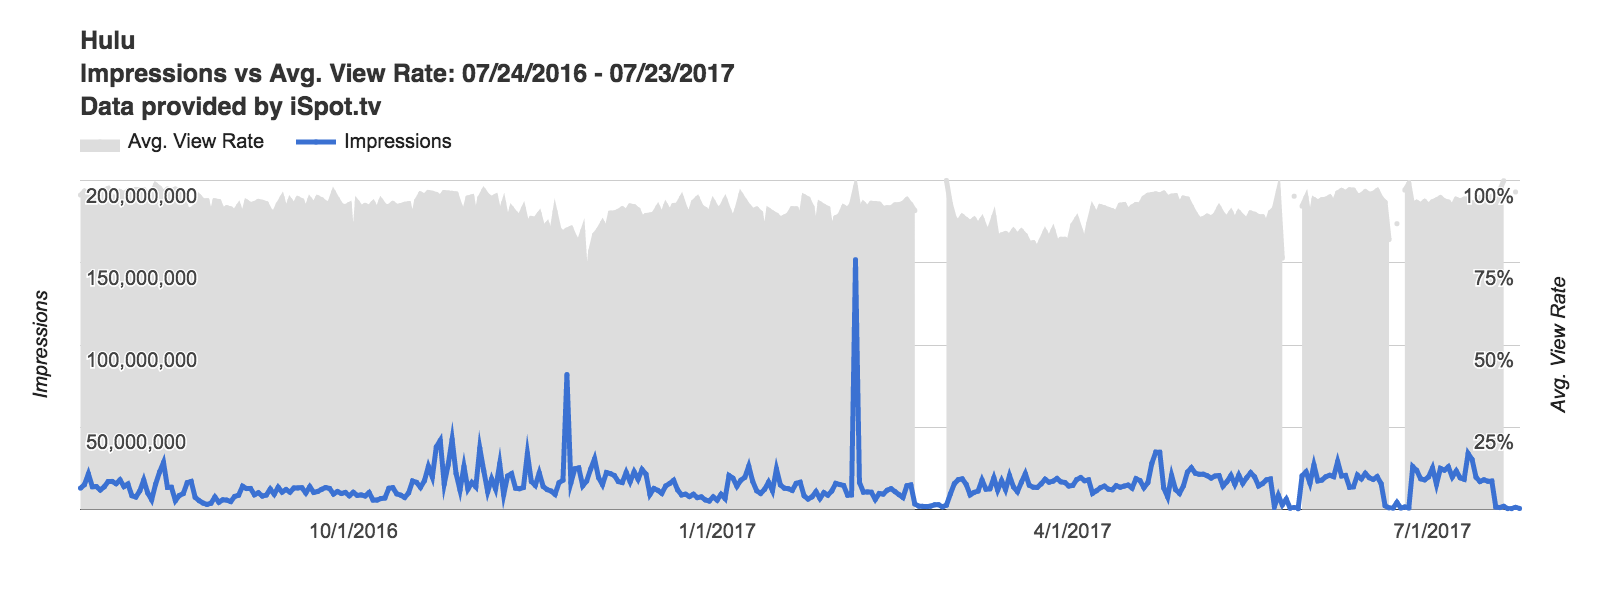 #3 Hulu spread the ball around on major networks-- looking at their investment in TV from an ad impression stand point, you can see Hulu was also picking off another hot tent pole in the last year (politics).
 That strategy has Hulu advertising reaching people under the average mean for TV (68). In fact, 67% of their ads reached folks under 55, with nearly 31% in that 18-34 sweet spot.
 (Special thanks to iSpot.tv the attention analytics company that measures TV ad activity from the glass of millions of smart TVs and tracks ad exposures to sales conversion activities)